
Population Characteristics
Before selecting any sample, it is necessary to have a good understanding of the population as a whole. This includes knowing what types of variables can be studied in the population, as well as determining the population’s level of homogeneity. Other issues, such as data availability and quality, are also important and are addressed later in this guide. (See the section on Analyzing the Population.)
Continuous and Categorical Variables
The variables of interest in a population can be of two general types: continuous and categorical. Continuous variables are variables that are expressed by a number along a continuum. Examples of continuous variables include:
- dollar value (e.g., the value of a transaction, purchase, or contract)
- distance (e.g., the distance from the nearest fire department)
- time (e.g., waiting time in an emergency room or the number of days taken to process a transaction)
- pollution levels (e.g., milligrams of mercury in fish)
Occasionally, it is necessary to categorize units of the population based on a continuous variable, such as creating categories for low, medium, and high dollar-value contracts. These categories can then be used to tailor a sampling approach.1
Categorical variables are non-continuous. Some examples include:
- marital status (single, married, separated, divorced, widowed)
- citizenship and immigration status (Canadian citizen, permanent resident, new immigrant, refugee)
- employment status (full-time, part-time, unemployed)
- educational level attained (primary school, high school, college, master’s degree, Ph.D.)
- geographic location (continent, country, province, region, city, neighbourhood)
- public administration (entity type, sector of activity, governance model)
While some categorical variables have units that can be rank ordered, such as educational levels, most represent distinct, non-hierarchical categories.
Regardless of the type of variable, categorical or continuous, the distribution of the variable can be assessed using diagrams (histograms for continuous variables and bar charts for categorical variables). As shown in Figure 2 and Figure 3, charts are an effective tool to assess how a population is distributed. (More information on how to analyze populations is in Part 2 of this guide.)
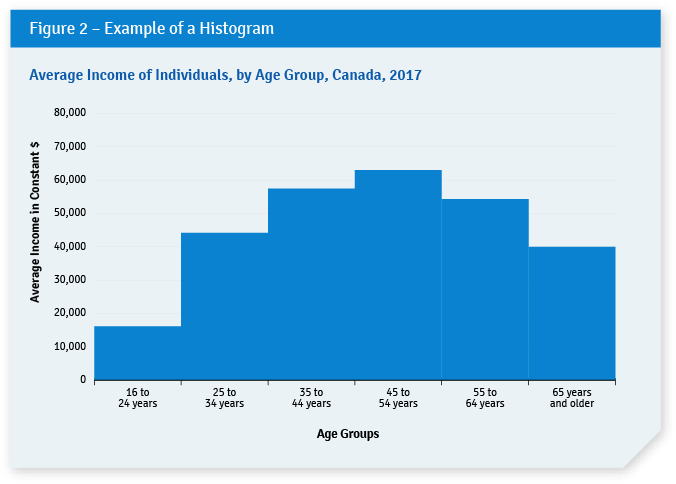
Source: Data from Statistics Canada, Income of individuals by age group, sex and income source, Canada, provinces and selected census metropolitan areas (accessed on 10 December 2020).
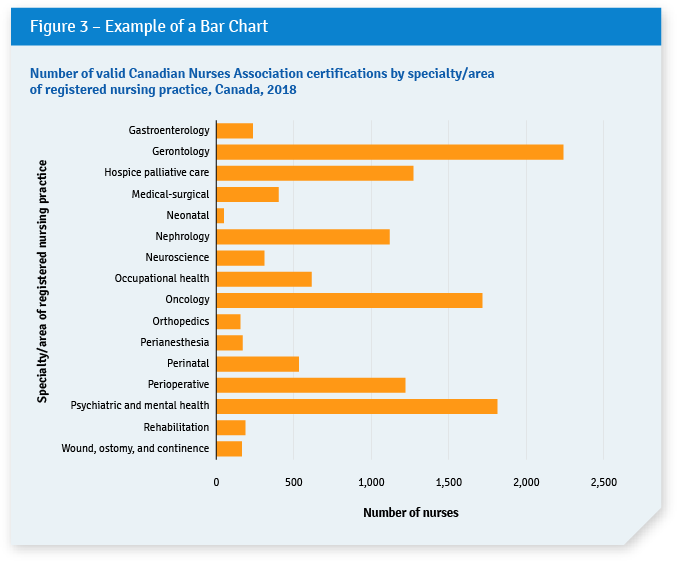
Source: Canadian Institute for Health Information (2019), Health Workforce, 2018: Indicators (based on information provided by the Canadian Nurses Association, Certification and Professional Development).
1 It is also possible to use a probability proportional to size sampling, a method in which a size measure is available for each population unit before sampling and where the probability of selecting a unit is proportional to its size. This is similar to a dollar unit sampling in a financial audit.
