
Confidence Intervals
The confidence interval is the range of values over which we can be reasonably confident that the true population value resides, given the result from a sample. Smaller, or narrower, confidence intervals mean that there is greater precision around an estimate of a population. For example, the narrower confidence interval of ±5% is more precise than the wider confidence interval of ±10%. In the first case, we may be confident that the true population value lies from 5% below the sample value to 5% above. In the second case, we would only be confident that the population value rests within the interval from 10% below (lower confidence limit) to 10% above (upper confidence limit)—a much wider range.
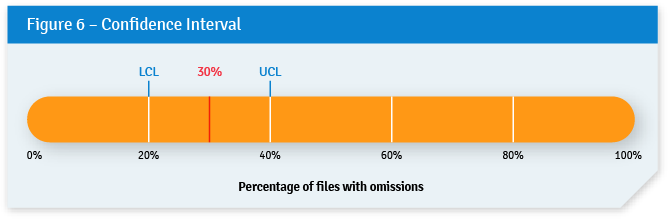
For instance, let’s assume that after a hypothetical examination of a sample of 50 files, the auditors found that 15 (or 30%) have major omissions. If the confidence interval is ±10%, then the highest likely value is 40%. This is called the upper confidence limit (UCL). Likewise, the lowest likely value is 20%. This is called the lower confidence limit (LCL). These concepts are illustrated in Figure 6.
While confidence intervals are often expressed with both a lower bound and an upper bound (e.g., ±10%), this is not the only option. Sampling may be done with either a one-sided or a two-sided confidence interval. Most statistical reporting in the media or by statistical agencies relies on two-sided confidence intervals because they show more complete information. Given the result from a sample, it shows both how low the true population value is likely to be, and how high. But auditing is different because the focus is often only on whether or not the population value exceeds a certain amount (for example, a maximum level of non-compliance in a process or program). In such cases, it is not necessary to take into account whether the extent of non-compliance in a population is lower than the estimate provided by the sample. The concern is rather with how much greater the non-compliance rate might be in the population than the rate estimated by the sample value.
One-sided sampling provides less information than two-sided sampling, but the benefit is that sample sizes are cut in half. This makes for more efficient audits by eliminating work that is not necessary to conclude on the audit objective. Most audit sampling software, such as IDEA and ACL, automatically computes sample sizes based on one-sided estimates. Whereas two-sided confidence intervals are normally expressed as ±10, for example, one-sided confidence intervals show only the "+" or the "–" sign, such as +10.
Confidence Levels
The confidence level is the extent of the certainty that the true population parameter of interest falls within the confidence interval. For example, if the level of precision of a sample estimate is a ±5% confidence interval with a 90% confidence level, then the true population parameter has a 90% chance of being within ±5% of the estimate. One of the most common misconceptions among auditors using audit sampling is that the confidence level relates to the sample value. It does not. Rather, it relates to the confidence interval surrounding the sample value. For instance, in Figure 6, with a confidence interval of ±10%, we would be 90% certain that the value is between 20% and 40%.
