Setting the Context
When writing the introduction to an audit report on mining revenues or financial assurances, auditors should clearly state why they carried out the audit and explain why the revenues or programs they audited are important. Doing so will provide an answer to the “so what?” question that readers might pose and will let the readers know why they should care about the audit topic.
The report’s introduction or background section should also provide sufficient context to enable readers to fully understand the audit findings. Depending on the breadth of the audit, this may include context on:
- the different methods of extraction for a particular mineral (see Figure 8 for an example),
- the value of extracted minerals in a country or region for a given year (see Figure 9),
- the royalty payments received by a government each year for different minerals (see Figure 10),
- the number of active exploration licences in a country or region over time and the total surface area covered by the licences (see Figure 11),
- the location of mining sites visited during an audit (see Figure 12), or
- the potential environmental impacts of a mineral extraction process (see Figure 13).
By using easy-to-understand charts and diagrams, as in the examples from published audits in Figures 8 to 13, auditors can effectively present useful context without using too many words. Using charts and diagrams will also break the text and make the report more visually appealing and easier to read.
However, preparing good charts and diagrams requires some planning: success will be more likely if auditors start thinking about presentation formats and the necessary data early in the audit. Waiting for the reporting phase to identify the data required for a chart or diagram may not leave enough time for the auditor to obtain reliable information and still meet reporting deadlines. Auditors should also remember that information used in charts and graphs must be subjected to rigorous quality assurance in the same way as other types of audit evidence.
Figure 8
Example of a Diagram Showing the Different Extraction Methods Used for a Particular Mineral
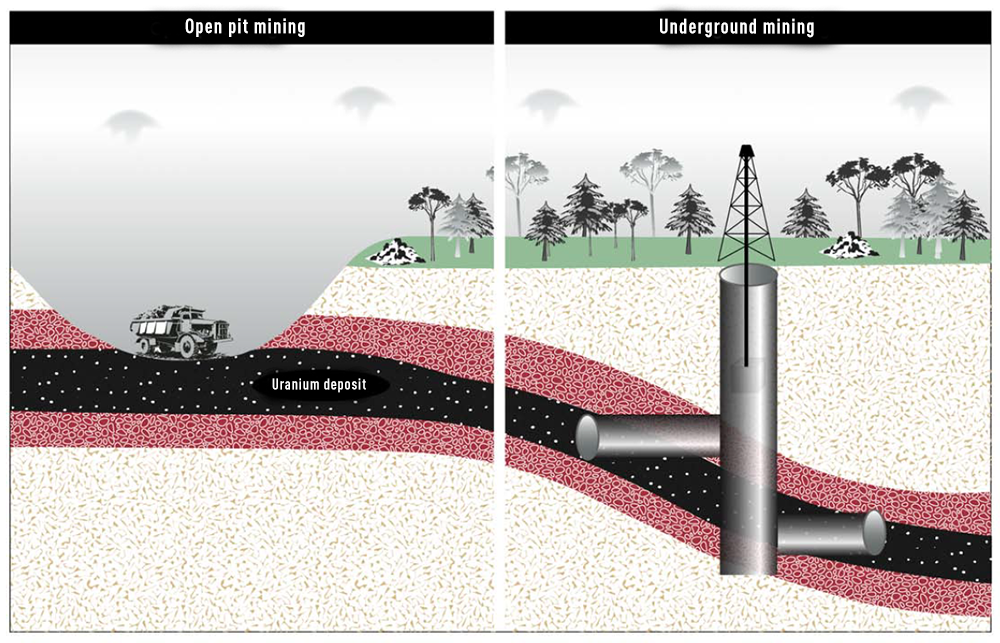
Source: Government Accountability Office of the United States of America (2012). Uranium Mining – Opportunities Exist to Improve Oversight of Financial Assurances
Figure 9
Example of a Diagram Showing the Value of Extracted Minerals in Each Province of a Country for a Given Year
Value of Canada’s Mineral Production, 2014 ($ billion)
Source of data: Ministry of Northern Development and Mines
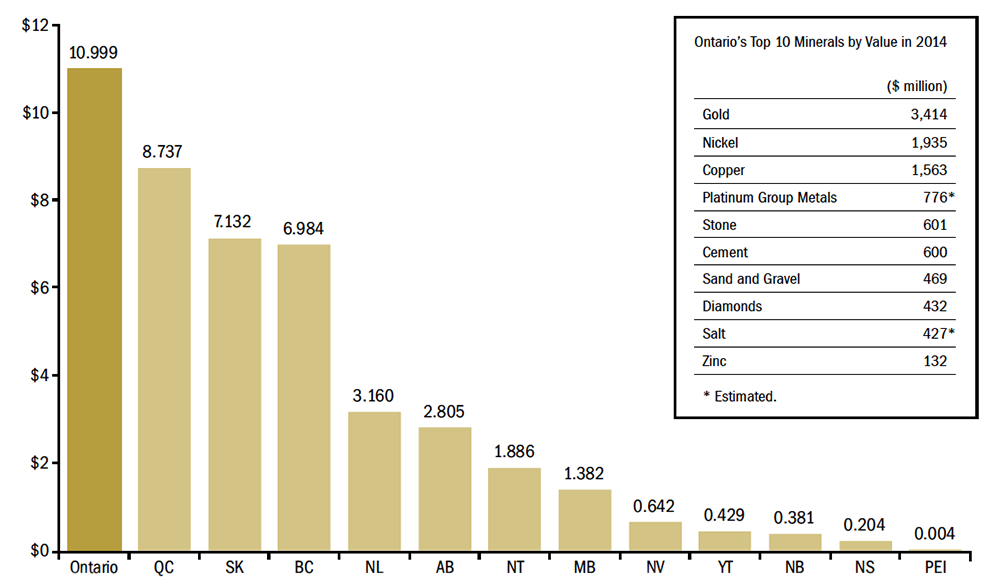
Source: Office of the Auditor General of Ontario (2015). Mines and Minerals Program
Figure 10
Example of a Chart Showing the Royalty Payments Received by a Government Over Time for Different Minerals
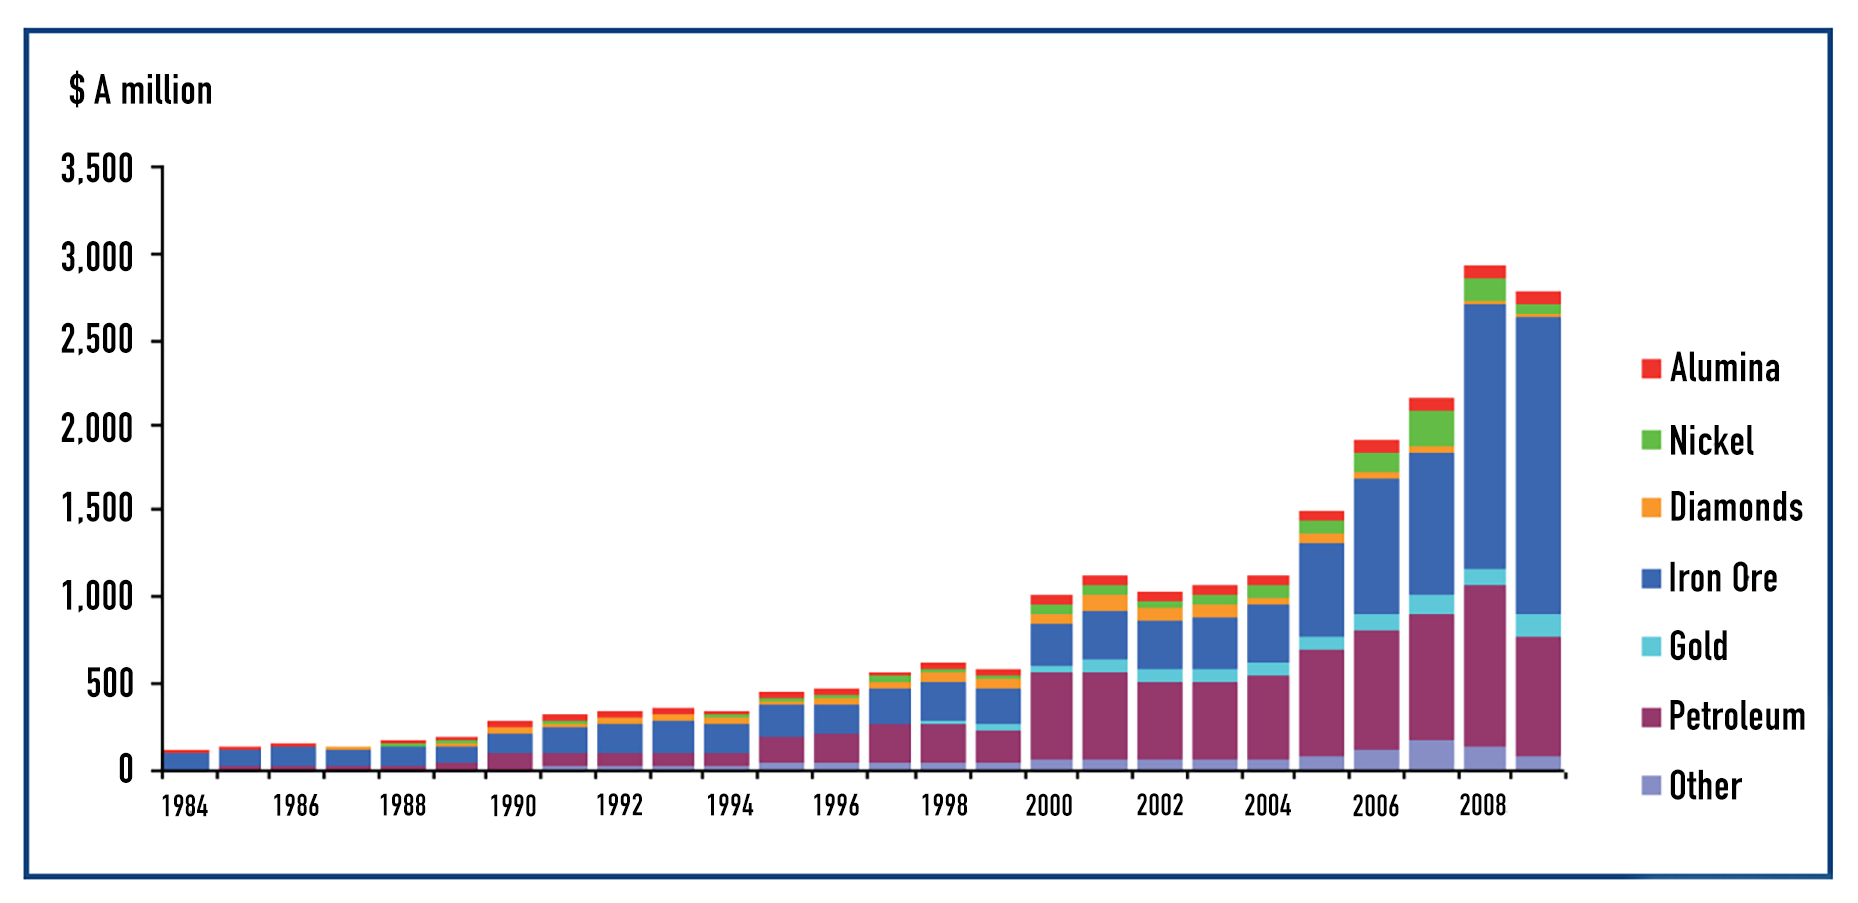
Source: Office of the Auditor General of Western Australia (2011). Ensuring Compliance with Conditions on Mining
Figure 11
Example of a Chart Showing the Number of Active Exploration Licences in Different Regions and the Surface Area Covered by the Licences
Evolution of the number of exploration claims and their total surface area
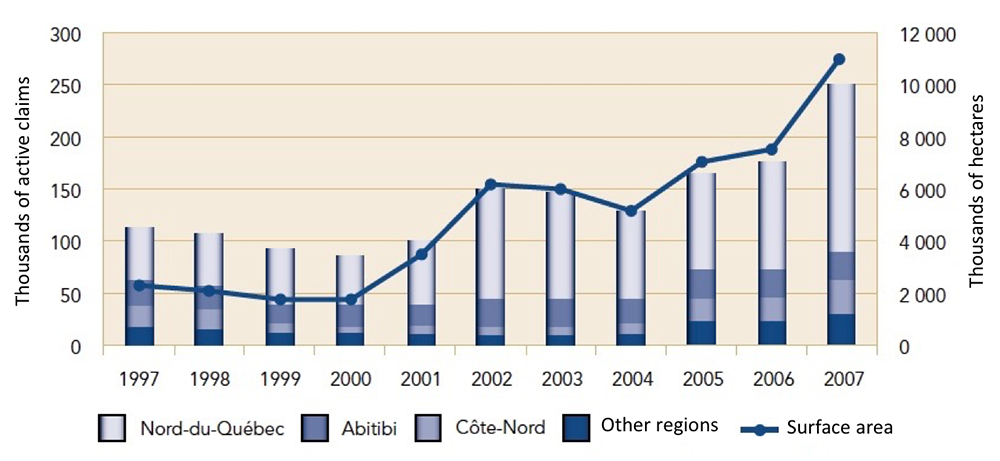
Source: Vérificateur général du Québec (2009). Interventions gouvernementales dans le secteur minier
Figure 12
Example of a Map Showing Mining Sites Visited During an Audit
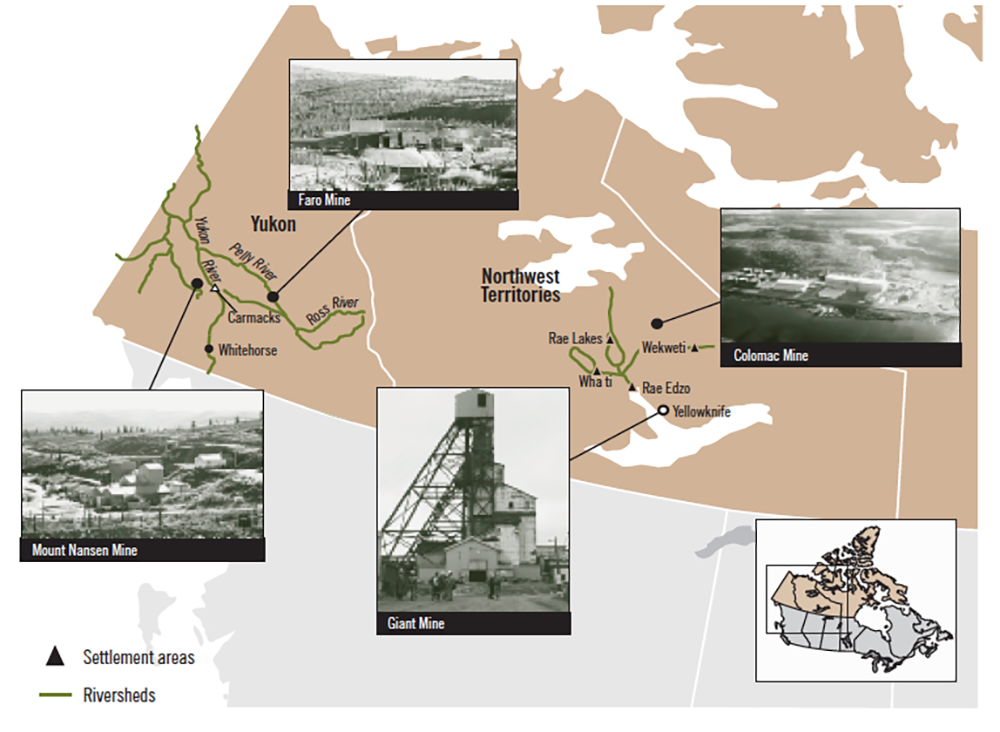
Source: Office of the Auditor General of Canada (2002). Abandoned Mines in the North
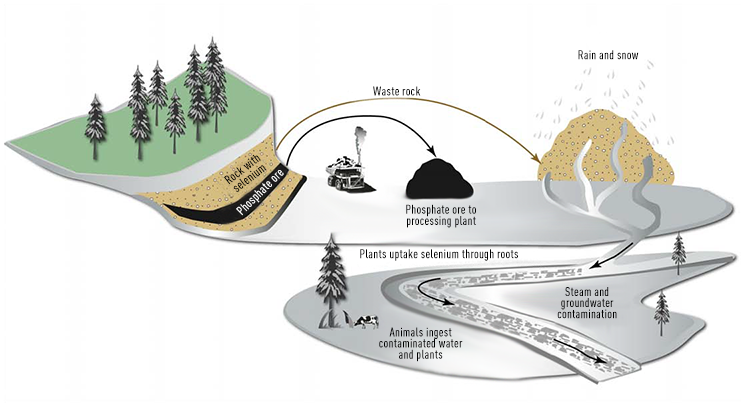
Figure 13
Example of an Illustration Showing the Potential Environmental Impacts of a Mineral Extraction Process
How Phosphate Mining Overburden Can Release Selenium